Wisely frugal: ensuring sustainable funding for novel cancer therapeutics through a budget impact analysis in resource-limited settings
Nuradh Joseph 1,2, Vimukthini Peiris2,3, Vodathi Bamunuarachchi,2,4, Prasad Abeysinghe2,4, Nadarajah Jeyakumaran2,4, Devinda Jayathilake2,4, Kanthi Perera2,4, Rohini Fernandopulle5 and Sanjeeva Gunasekera2,4
1District General Hospital – Hambantota 82000, Sri Lanka
2Sri Lanka Cancer Research Group, Maharagama 10280, Sri Lanka
3District General Hospital – Vavuniya 43000, Sri Lanka
4Apeksha Hospital, Maharagama 10280, Sri Lanka
5Sir John Kotalawela Defence University 10390, Kandawala, Sri Lanka
Abstract
Introduction: Cancer care in Sri Lanka is predominantly provided through its state health system which is free at the point of delivery. We performed a budget impact analysis of novel cancer drugs with a view to enabling better prioritising of their procurement.
Methods: Median survival gain was obtained for each indication of a novel cancer drug by a review of the literature. The direct cost of drug procurement was obtained from the Ministry of Health of Sri Lanka and the cost per life year gained was computed for each indication. Two thresholds - per capita gross domestic product (GDP) per life year gained (GDP × 1 = US$3815) and three times per capita GDP per life year gained (GDP × 3 = US$11445) were considered to determine cost effectiveness. The cumulative annual cost of these treatments was subsequently determined.
Results: Data obtained on 42 novel cancer drugs spanning across 90 indications were included in the analysis. The cumulative annual treatment cost when the threshold was set at GDP × 1 was United States Dollar (US$) 6 million and it increased to US$ 13.2 million if the threshold was expanded (GDP × 3 = US$11445). Only 27 indications met the (GDP × 3 = US$11445) threshold while there were 18 drugs that did not meet the thresholds for any indication. Without a threshold, if every eligible patient were to receive treatment as currently indicated, the total cost would reach almost US$ 300 million per year.
Conclusion: Budget impact analyses and defining cost-effectiveness thresholds will lead to considerable savings and help prioritise the procurement of novel agents in the state health system in Sri Lanka.
Keywords: Essential drugs, medical oncology, cost-effectiveness, lower middle-income countries, novel drugs, cancer therapeutics, budget-impact analysis
Correspondence to: Nuradh Joseph
Email: nuradh@gmail.com
Published: 02/07/2025
Received: 11/09/2024
Publication costs for this article were supported by ecancer (UK Charity number 1176307).
Copyright: © the authors; licensee ecancermedicalscience. This is an Open Access article distributed under the terms of the Creative Commons Attribution License (http://creativecommons.org/licenses/by/4.0), which permits unrestricted use, distribution, and reproduction in any medium, provided the original work is properly cited.
Introduction
Sri Lanka has an age-adjusted annual incidence of 129 cancer cases per 100,000 population with nearly 32,000 new patients being diagnosed each year, according to data from the national cancer registry [1]. However, the actual incidence might be considerably higher due to under-reporting of cases [2].
Cancer care in Sri Lanka is predominantly provided through its public funded state health system which is free at the point of delivery2,3. Funded by general taxation, this system functions as a network of primary, secondary and tertiary care hospitals under the administrative control of the Ministry of Health [2,3]. Clinical oncology services are provided by 26 cancer centres located throughout the island2,3.
Each year, the Ministry of Health of the government of Sri Lanka allocates around 210 million United States Dollar (US$) for the procurement of drugs for hospitals under its purview [4]. At the beginning of 2022, Sri Lanka faced a foreign exchange crisis arising from years of imprudent macroeconomic fiscal policies aggravated by the Covid-19 pandemic [5].
The crisis was devastating and almost led to a calamitous breakdown of Health services, and procurement of pharmaceuticals from abroad proved extremely challenging5. Since virtually all oncology drugs are imported, the economic crisis posed a major threat to cancer care.
We performed a budget impact analysis of novel cancer drugs with a view to compiling a list of essential drugs and approved indications to help prioritise procurement and help mitigate the impact on cancer care.
Methods
Our primary objective was to determine the treatment cost per life year gained for each indication of a novel cancer drug. Since the focus is on novel therapeutics, conventional anti-neoplastic agents where the total cost of treatment was less than 1,000 US$ were excluded from the analysis.
Computing survival gain
Since data on quality-adjusted life years was not available in the local setting we considered life years gained as the outcome parameter. This was obtained from publications of pivotal randomised controlled trials for drug and indication.
In the palliative setting, median overall survival (OS) was the outcome variable. In trials, where there was a significant crossover of treatment, progression-free survival gain was considered, especially if reliable estimates of OS were not available.
In the adjuvant curative setting, we considered OS gains, where this was reported. In indications, where OS data was not mature we substituted DFS gain as the outcome measure. Although DFS gains may not directly translate into improvements in OS, we felt it was still important to perform an analysis to have some indication of cost-effectiveness. Life years gained in the curative setting were calculated as described fully in Supplementary Figure S1 and Supplementary Box 1. In summary, this calculation was performed assuming that on average the survivors at the end of follow-up would go on to live up to life expectancy.
The cost of each individual drug procured during the year 2021 was obtained from the Medical Supplies division of the Ministry of Health published on its website [6]. Since the procurement of drugs by the Ministry is done through an open tender procedure the price listed on the Ministry website is indicative of its true cost, there were no confidential discounts or rebates. This was converted to United States Dollars based on the average exchange rate for the year 2021.
The direct drug cost for a standard course of treatment was computed as for an adult male weighing 50 kg with a body surface area of 1.3. Indirect costs as well as costs of administration such as intravenous cannulas, infusion sets and so on, were not considered.
If the novel therapeutic agent was not an additive treatment, the costs of the drugs used in the comparator arm were subtracted from the cost of the novel agents.
The cost of treatment per patient was computed by multiplying the total dose required for a course of treatment by the unit cost. In curative settings, treatment is predetermined by protocol and the total drug dose for the whole course is computed.
For palliative indications, the median duration of treatment and/or number of treatment cycles were obtained from published studies and total drug dose was computed. If the median duration of treatment or treatment exposure was not reported the median progression-free survival was substituted since in the palliative setting treatment is often continued until disease progression.
Cost per life year gained
The cost per life year gained was then computed by dividing the total cost of treatment by the life years gained by the treatment.
Trials of treatment de-escalation
We also considered studies of statistically proven equivalence or non-inferiority of de-escalated treatment. We assumed that the survival gains of the de-escalated treatment were the same as a standard treatment and the cost of de-escalated treatment was computed and divided by the life-years gained of the standard treatment to determine the cost per life year gained by the de-escalated treatment.
Cost-effectiveness thresholds
Three thresholds based on World Health Organisation recommendations were used for this analysis - viz: less than the per capita annual gross domestic product (GDP) per life year gained (GDP × 1 = US$3815; highly cost-effective), 3 times the per-capita annual GDP per life year gained (GDP × 3 = US$11445; cost-effective) and 4 times the per-capita annual GDP per life year gained (GDP × 4 = US$15260; potentially cost-effective with price reduction) were considered. The per capita GDP of Sri Lanka for the year 2021 was obtained to compute these thresholds [12,13].
Total annual cost for each indication
The total cost of treatment per year for each indication for the entire country was computed by multiplying the total cost per patient by the estimated number of patients likely to be treated in each indication. While national incidence data for each cancer is available in the National Cancer Registry, there is a paucity of data on stage distribution. As such, three oncologists independently estimated the number of patients likely to be treated in each indication during a year. The mean value of the number estimated by the three oncologists was taken for the analysis.
The list of references used to obtain data for each treatment are listed in the Supplementary Table S1.
Results
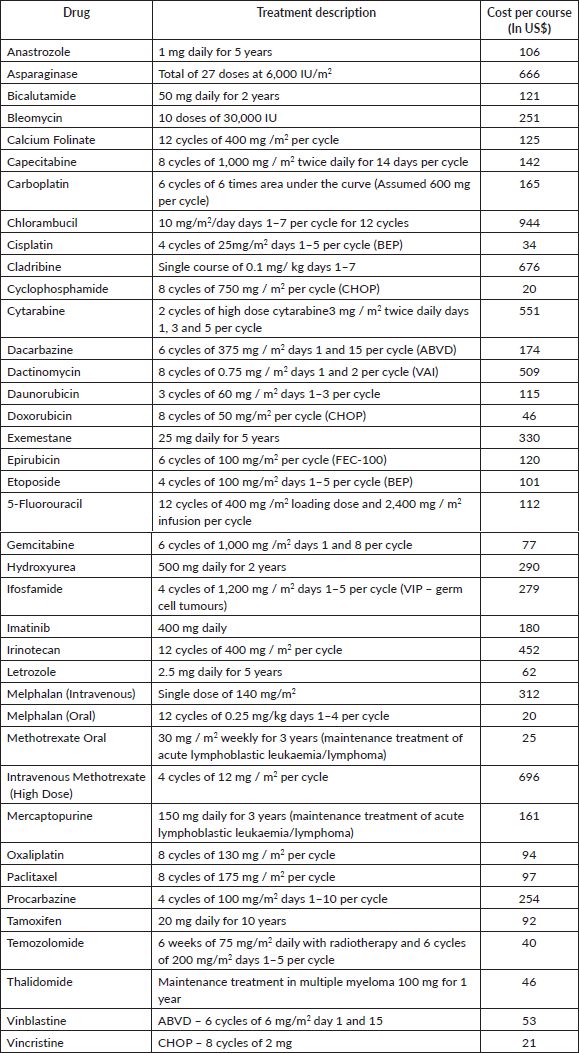
The average exchange rate for the year 2021 was 200 Sri Lankan Rupees per US$[7]. The per capita GDP for the year 2021 was US$ 3815. The cost of treatment per standard treatment course was obtained for 83 oncology drugs [8]. Conventional agents that were excluded from the analysis are shown in Supplementary Table S2 along with the cost per standard treatment course.
After the exclusion of these drugs, 41 drugs spanning across 83 indications in the palliative setting and 6 drugs across 10 indications in the adjuvant setting were included in the analysis. A full description of the analysis including the clinical trials from which outcome data was obtained from is included in the supplementary appendix.
There were two drugs for which de-escalated treatment was of relevance. When analysing abiraterone, we considered a low-dose treatment regimen of 250 mg with food and the standard dose of 1,000 mg on an empty stomach for each indication. Similarly for adjuvant trastuzumab we considered 6 months of treatment as well as 12 months of treatment.
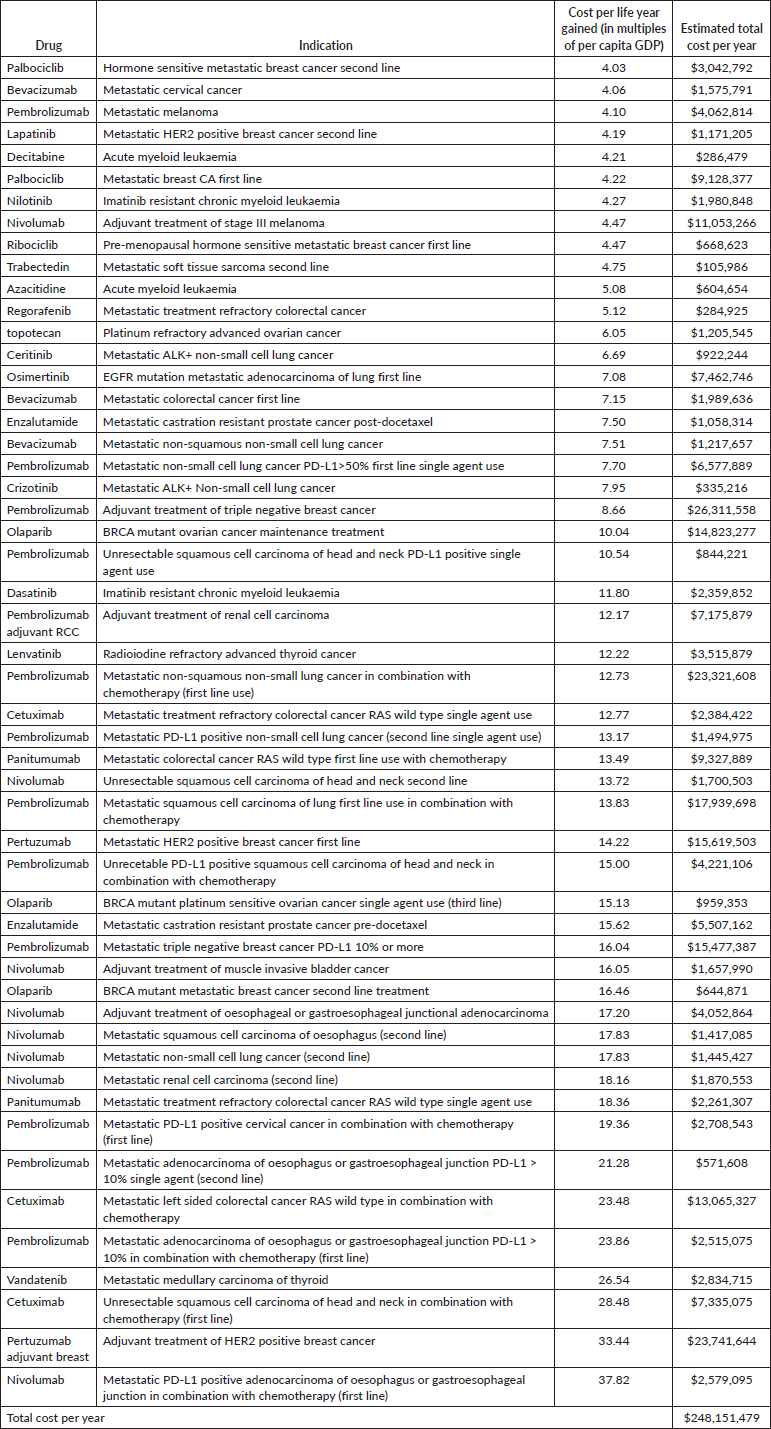
Tables 1 and 2 list the highly cost-effective and cost-effective drug indications, respectively, along with the total annual cost of procurement for these drugs. Supplementary Tables S3 and S4 list the drugs and indications that are potentially cost-effective and not cost-effective, respectively. Figure 1 shows the plot for cumulative annual procurement cost against per capita GDP per life year gained.
Table 1. Highly cost-effective treatments (Cost per life year gained less than per capita GDP).
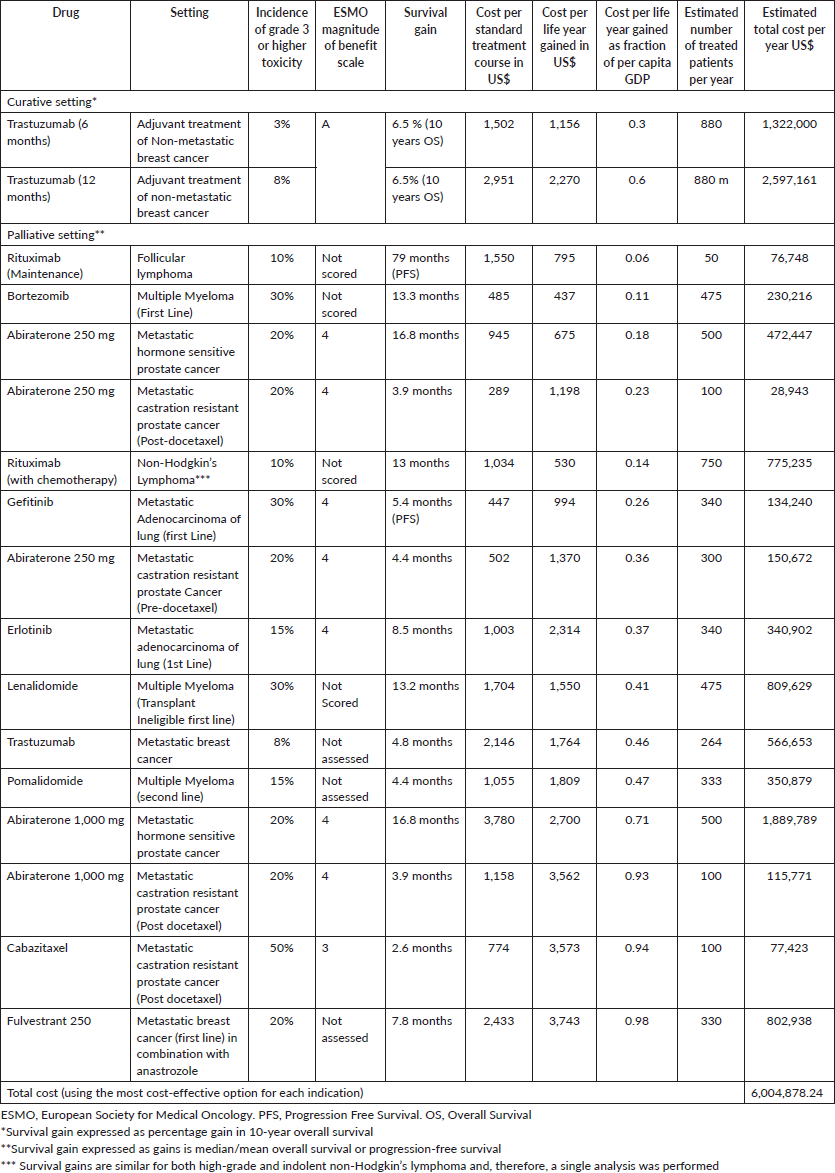
Table 2. Cost-effective treatments (drug cost per life year gained between 1 and 3 times per capita GDP).
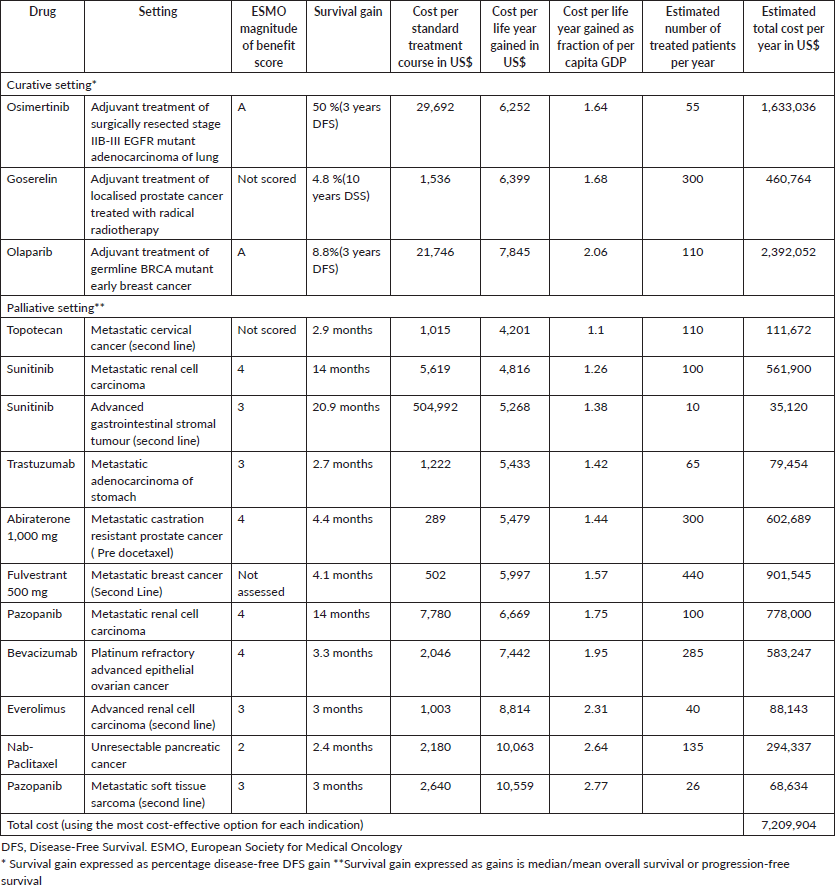
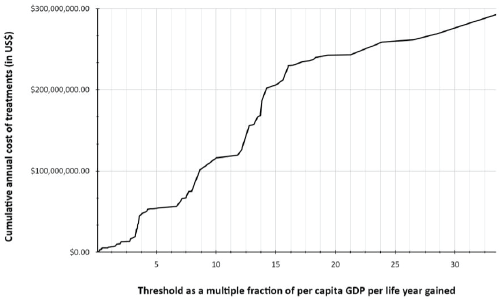
Figure 1. Cumulative cost of treatments of novel drugs in relation to cost-effectiveness thresholds based on per capita GDP per life year gained.
The total cost of treatment is US$ 6 million if a threshold of per capita GDP per life year gained GDP × 1 = US$3815 was set and US$ 13.2 million if it was per capita GDP × 3 = US$11445 per life year gained. If the threshold is increased to GDP × 4 = US$15260, the total cost would rise to US$ 47.3 million. If no threshold was set, Sri Lanka’s health system would need US$ 295 million to fund these novel drugs.
Discussion
The allocation of funds for healthcare in a public funded state health system is determined by political authorities and is often influenced by the general macroeconomic situation of the country [9]. Once the allocation is decided, it is imperative that a budget impact analysis be performed and cost effectiveness-based thresholds be considered to ensure maximum benefit from the drugs procured by each health system [10]. In the absence of thresholds, frequent shortages of novel cancer therapeutics will be inevitable when the allotted budget is expended thereby denying these drugs to patients across all indications.
Through this study, we show that a simple budget impact analysis could provide some data for a cost-effectiveness threshold-based strategy to ensure sustainability in the provision of novel cancer therapeutics in health systems such as ours. We believe that our work would find resonance with healthcare systems of other low and middle-income countries (LMICs).
We used the per capita GDP-based thresholds as proposed by the World Health Organisation (WHO). There are a number of criticisms of setting cost-effectiveness thresholds based on per capita GDP. However, for health systems such as ours, the WHO thresholds provide a practical ‘starting-point’ [10,11,12]. In this respect our work provides evidence for the usefulness of the cut-off of per capita GDP × 3 = US$11445 per life year gained as the threshold for determining cost-effectiveness in LMICs [10,11,12].
Based on this threshold, the budget for procurement of novel cancer therapeutics would be approximately US$ 13.2 million which would be around 9% of the total drug budget of the state health system. Increasing the threshold to GDP × 4 = US$15260 would nearly triple the amount of funding required, further validating the robustness of the WHO threshold of GDP × 3. Without cost thresholds, the cumulative annual cost of the currently procured novel drugs would be nearly US$ 300 million, assuming that every eligible patient would receive treatment. This is around 1.5 times the total annual budget of all drugs in the state health sector and is clearly unsustainable. In a time of financial crisis, the lower threshold of per capita GDP per life year gained (GDP × 1 = US$3815) can be used to prioritise procurement. As shown by our data, a total allocation of approximately US$ 6 million would be sufficient to ensure the supply of these highly cost-effective drugs.
Furthermore, defining a cost-effectiveness threshold would also provide an incentive for pharmaceutical suppliers to reduce the price of drugs thereby leading to cost savings. These savings could be channeled to more cost-effective treatment modalities such as radiotherapy and surgery. Indeed, studies have shown that the dearth of quality radiotherapy resources in Sri Lanka has adversely impacted on outcomes of potentially curative cancers [14,15]. Investing in screening and streamlining early detection pathways may also lead to significant improvements in survival [16,17].
Except for ibrutinib which is not registered in Sri Lanka, all treatments mentioned in the WHO essential drugs list were found to be cost-effective in our setting as well [18]. However, there were several other treatments that were not included in the WHO list that were found to be cost-effective in our study, which are listed in Box 1. Two such treatments, adjuvant osimertinib in resected in adenocarcinoma of the lung and adjuvant olaparib in early germline BRCA mutation-positive breast cancer, are very recent developments [19,20]. Nevertheless, this underscores the importance of performing local cost-effectiveness assessments to take into account cost variations in different health systems.
Another salient finding of our work is the cost-savings that can be achieved by using lower doses of abiraterone for metastatic prostate cancer and a shorter duration of adjuvant treatment with trastuzumab in early breast cancer, both of which have robust evidence in the form of non-inferiority randomised clinical trials [21,22].
For abiraterone, a lower dose of 250 mg with food was shown to have equal efficacy in terms of biochemical response in castration-resistant prostate cancer [21]. The clinical equipoise can be safely extrapolated to the hormone-sensitive phase of the disease as well and this is borne out by the inclusion of the lower dose option in the NCCN guidelines for both settings [23].
Box 1. Cost-effective treatments not included in the World Health Organisation list of essential medicines.
- Abiraterone for hormone sensitive metastatic prostate cancer.
- Pomalidomide in the treatment of relapsed/refractory multiple myeloma.
- Topotecan in the second line treatment of advanced cervical cancer.
- Cabazitaxel in the treatment of metastatic castration resistant prostate cancer (post-docetaxel).
- Fulvestrant in the first and second line treatment of endocrine sensitive metastatic breast cancer.
- Sunitinib in the first line treatment of metastatic renal cell carcinoma treatment of gastrointestinal stromal tumour (GIST).
- Nab-paclitxael in the first line treatment of unresectable advanced pancreatic cancer.
- Bevacizumab for platinum refractory advanced epithelial ovarian cancer.
- Trastuzumab for HER2 positive metastatic gastric cancer.
- Adjuvant osimertinib in resected high risk EGFR mutation locoregional adenocarcinoma of lung.
- Adjuvant olaparib for germline BRCA mutation positive HER2 negative high risk early breast cancer.
- Sunitinib for first line treatment of metastatic renal cell cancer.
- Pazopanib for first line treatment of metastatic renal cell cancer.
- Sunitinib for second line treatment of unresectable gastrointestinal stromal tumours.
- Pazopanib for second line treatment of metastatic or unresectable soft tissue sarcoma.
Even though the landmark PERSEPHONE trial of more than 4,000 patients proved non-inferiority for 6 months of adjuvant trastuzumab with 12 months of treatment, the oncology community has been slow to adopt this partly due to concerns with its subgroup analysis showing superiority of 12 months of treatment in patients receiving concurrent trastuzumab with chemotherapy [24]. However, clinicians in LMICs such as ours would be well advised to opt for 6 months of adjuvant trastuzumab due to its substantial cost savings and the uncertain benefit of extending adjuvant treatment to 1 year, which if at all, is likely to be marginal. The newer anti HER-2 monoclonal antibody Pertuzumab was not even remotely cost-effective either in the adjuvant or metastatic setting. Trastuzumab emtansine has not been used in the state health sector and we were, therefore, unable to perform an analysis of cost-effectiveness. However, unless very substantial price reductions are made these agents are unlikely to be cost-effective in our setting.
With regard to multiple drugs for the same indication, we found that abiraterone was substantially more cost-effective than enzalutamide in metastatic prostatic cancer both in its hormone-sensitive and castration-resistant phases. Similarly, gefitinib and erlotinib were superior to osimertinib in the first-line treatment of metastatic adenocarcinoma of the lung, while pembrolizumab was more cost-effective than nivolumab in metastatic melanoma.
Despite gaining approval for multiple malignancies, the immunotherapeutic agents Pembrolizumab and Nivolumab failed to reach the cost threshold in almost all indications with the exception of metastatic melanoma, where it was potentially cost-effective.
It is unlikely that these drugs would be affordable in the health systems of LMICs such as ours in the near future. However, encouraging results from recent trials exploring the efficacy of lower doses of these agents. Provides some hope, and more studies in this space are an imperative need [25].
Analysis of agents used in the first-line treatment of Chronic Myeloid Leukaemia posed many issues since it takes the form of a chronic disease entity where treatment extends beyond 10 years, When considering imatinib in the first-line treatment of chronic myeloid leukemia (CML), its cost is cheaper than the comparator interferon-alpha and low dose cytarabine. Since the annual treatment cost per patient for imatinib was only 180 US$ we excluded it from this analysis since its cost-effectiveness is evident. Due to short follow-up in the clinical trials of first-line treatment of CML, with the novel tyrosine kinase agents nilotinib and dasatinib, it was not possible to determine the survival gain accurately [26]. However, the overall survival gain over imatinib is likely to be very modest in the first-line setting and these agents are substantially more expensive than imatinib [26]. Over a 10-year period, nilotinib and dasatinib would cost US$ 53,000 and 44,347 more than imatinib, respectively.
We lacked the resources and expertise for a comprehensive health economic analysis as done by institutions such as the National Institute for Health and Care Excellence in the United Kingdom. In our analysis, we only considered the direct cost of the drug. The cost of drug administration, investigations, staff costs and so on, were not included. Furthermore, in the absence of data on quality of life in our setting, we were compelled to consider life years gained as the outcome variable rather than quality-adjusted life years. This also meant that more robust cost-effectiveness analysis methods such as a Markov model could not be performed. Since the WHO thresholds are based on quality-adjusted life years gains and not life years gained our data is likely to overestimate the benefit of treatment. More studies evaluating quality of life and cost of treatment in the state health sector are required as a matter of urgency.
The use of median overall survival gain may somewhat underestimate the benefit of immunotherapeutic agents where there is a ‘long-tail’ in the survival curve. We used mean restricted survival gain which is a more robust parameter, if this was reported in the publications.
Since survival gains in real-world populations could be significantly lower than that of patients treated in clinical trials, our analysis may have overestimated the benefit of novel cancer therapeutics.
For the budget impact analysis, we had to estimate the total number of cases per year for the whole country for each indication. While data on the incidence of each cancer is available in the National Cancer Registry, there is a paucity of data on other variables such as stage distribution, lines of treatment and so on. As such, the likely number of cases for each indication for the whole country was determined by taking the mean value of the estimates made by three oncologists. Sri Lanka has a centralised health system, and oncologists serve on rotation in centres throughout the country and we felt that a reasonable estimate could be obtain by this method.
Another potential drawback of our approach is that it does not factor in drugs repurposed for use in orphan diseases, since there is unlikely to be data from randomised trials in these settings. As the number of cases are low, the budgetary impact of using these repurposed drugs is likely to be minimal. The Sri Lankan public health system already has a mechanism in place for such drugs to be requested on a case-by-case basis.
We also did not consider the use of non-pharmacological alternatives such as orchiectomy for androgen deprivation in prostate cancer. The inability to determine quality-adjusted life year gains for novel therapeutics should not deter health systems such as ours from using more simple metrics when setting cost-effectiveness thresholds. As shown by our results even rudimentary analysis could provide valuable insights when making decisions on funding. Some data are certainly better than none in this regard.
Our intention was to highlight the importance of cost-effectiveness thresholds in determining novel cancer drug procurement and usage in health systems such as ours. We believe this has been achieved by our work, notwithstanding the limitations mentioned above.
Conflicts of interest
None.
Funding
This work did not receive any specific funding from any private, governmental or non-governmental institution.
Ethics approval and consent to participate
Not applicable.
Consent for publication
Not applicable.
References
1. National Cancer Control Programme, Ministry of Health, Sri Lanka (2019) Cancer Incidence Data [https://www.nccp.health.gov.lk/storage/post/pdfs/Cancer%20Incidence%20Data%20Book-2019_compressed.pdf] Date accessed: 29/07/2022
2. Joseph N, Gunasekera S, and Ariyaratne Y, et al (2019) Clinical oncology in Sri Lanka: embracing the promise of the future Int J Radiat Oncol Biol Phys 105(3) 466–470 https://doi.org/10.1016/j.ijrobp.2019.04.023 PMID: 31540589
3. Gunasekera S, Seneviratne S, and Wijeratne T, et al (2018) Delivery of cancer care in Sri Lanka J Cancer Policy 18 20–24 https://doi.org/10.1016/j.jcpo.2018.10.001
4. Ministry of Health Sri Lanka (2019) Annual Health Bulletin p: 232 [http://www.health.gov.lk/moh_final/english/public/elfinder/files/publications/AHB/2020/AHB%202019.pdf] Date accessed: 27/07/2022
5. Das M (2022) Economic crisis in Sri Lanka causing cancer drug shortage Lancet Oncol 23(6) 710 https://doi.org/10.1016/S1470-2045(22)00254-6 PMID: 35490697
6. Medical Supplies Division, Ministry of Health, Sri Lanka (2022) Standard Item Price List [https://www.msd.gov.lk/files/Pdf/price_list_2022.pdf] Date accessed: 27/07/2022
7. Ministry of Health, Sri Lanka (2015) Non-Communicable Disease Risk Factor Survey [https://untobaccocontrol.org/impldb/wp-content/uploads/sri_lanka_2018_annex-2_STEPS_report_2015.pdf]
8. Exchange Rates UK (2021) US Dollar to Sri Lankan Rupee Spot Exchange Rates for 2021 [https://www.exchangerates.org.uk/USD-LKR-spot-exchange-rates-history-2021.html] Date accessed: 27/07/2022
9. World Bank World (2022) Bank Data on Per Capita GDP - Sri Lanka [https://data.worldbank.org/indicator/NY.GDP.PCAP.CD?locations=LK] Date accessed: 27/07/2022
10. Chi YL, Blecher M, and Chalkidou K, et al (2020) What next after GDP-based cost-effectiveness thresholds? Gates Open Res 4 176 https://doi.org/10.12688/gatesopenres.13201.1
11. Edejer TT, Baltussen R, and Tan-Torres T, et al (editors) (2003) Making Choices in Health: WHO Guide to Cost-Effectiveness Analysis (Geneva: World Health Organisation)
12. Robinson LA, Hammitt JK, and Chang AY, et al (2017) Understanding and improving the one and three times GDP per capita cost-effectiveness thresholds Health Policy Plan 32(1) 141–145 https://doi.org/10.1093/heapol/czw096
13. Bellido H, Olmos L, and Román-Aso JA (2019) Do political factors influence public health expenditures? Evidence pre- and post-great recession Eur J Health Econ 20(3) 455–474 https://doi.org/10.1007/s10198-018-1010-2
14. Joseph N, Jayalth H, and Balwardena J, et al (2020) Radical external beam radiotherapy in combination with brachytherapy for cervical cancer in Sri Lanka: Is treatment delayed treatment denied? JCO Global Oncol 6 1574–1581 https://doi.org/10.1200/GO.20.00196
15. Rupasinghe T, Silva DC, and Balawardena J, et al (2021) Curative intent radiotherapy for squamous cell carcinoma of the head and neck in Sri Lanka: the impact of radiotherapy technique on survival Clin Oncol 33(12) 765–772 https://doi.org/10.1016/j.clon.2021.09.017
16. Hewage SA, Samaraweera S, and Joseph N, et al (2022) Presentation, diagnosis and treatment delays in breast cancer care and their associations in Sri Lanka, a low-resourced country Clin Oncol (R Coll Radiol) 34(9) 598–607 https://doi.org/10.1016/j.clon.2022.05.007 PMID: 35672184
17. Balawardena J, Skandarajah T, and Rathnayake W, et al (2020) Breast cancer survival in Sri Lanka JCO Global Oncol 20 3 https://doi.org/10.1200/JGO.20.00003]
18. World Health Organisation (2021) World Health Organisation Model List of Essential Medicines – 22nd List, 2021 (Geneva: World Health Organisation)
19. Wu YL, Tsuboi M, and He J, et al (2020) Osimertinib in resected EGFR-mutated non-small-cell lung cancer N Engl J Med 383(18) 1711–1723 https://doi.org/10.1056/NEJMoa2027071 PMID: 32955177
20. Tutt ANJ, Garber JE, and Kaufman B, et al (2021) Adjuvant olaparib for patients with BRCA1- or BRCA2-mutated breast cancer N Engl J Med 384(25) 2394–2405 https://doi.org/10.1056/NEJMoa2105215 PMID: 34081848 PMCID: 9126186
21. Szmulewitz RZ, Peer CJ, and Ibraheem A, et al (2018) Prospective international randomized phase II study of low-dose abiraterone with food versus standard dose abiraterone in castration-resistant prostate cancer J Clin Oncol 36(14) 1389–1395 https://doi.org/10.1200/JCO.2017.76.4381 PMID: 29590007 PMCID: 5941614
22. Earl HM, Hiller L, and Vallier AL, et al (2019) 6 versus 12 months of adjuvant trastuzumab for HER2-positive early breast cancer (PERSEPHONE): 4-year disease-free survival results of a randomised phase 3 non-inferiority trial Lancet 393(10191) 2599–2612 https://doi.org/10.1016/S0140-6736(19)30650-6 PMCID: 6615016
23. National Comprehensive Cancer Network (2019) National Comprehensive Cancer Network: Prostate Cancer, 2019 [http://www.nccn.org/professionals/physician_gls/pdf/prostate.pdf]
24. Morganti S, Bianchini G, and Giordano A, et al (2022) How I treat HER2-positive early breast cancer: how long adjuvant trastuzumab is needed? ESMO Open 7(2) 100428 https://doi.org/10.1016/j.esmoop.2022.100428 PMID: 35272131 PMCID: 8908056
25. Li N, Zheng B, and Cai HF, et al (2018) Cost effectiveness of imatinib, dasatinib, and nilotinib as first-line treatment for chronic-phase chronic myeloid leukemia in China Clin Drug Investig 38(1) 79–86 https://doi.org/10.1007/s40261-017-0587-z
26. Patel A, Goldstein DA, and Tannock IF (2022) Improving access to immunotherapy in low- and middle-income countries Ann Oncol 33(4) 360–361 https://doi.org/10.1016/j.annonc.2022.01.003 PMID: 35033637
Supplementary materials
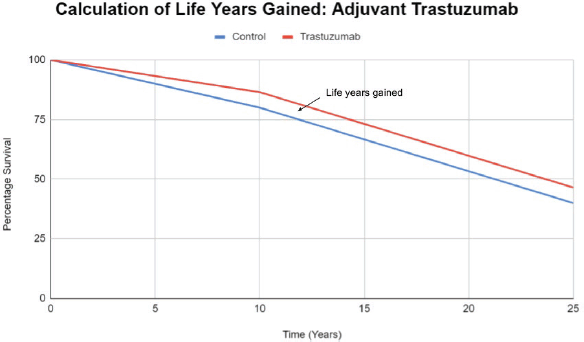
Supplementary Figure S1. Calculation of life years gained in the curative setting.
Supplementary Box S1. Example calculation of life years gained in the adjuvant setting using trastuzumab in early breast cancer as an example.
Overall survival gain at end of 10 years follow up = 6.5 %
Assuming OS gain is proportionate throughout follow-up mean survival gain during follow-up=6.5%/2 = 3.25%
Calculating Life years gained during follow-up:
(OS gain as a fraction/2) * (duration of follow-up/2)
(0.065/2) * 10 = 0.325 years
Calculating Life years gained after follow-up
Life years after follow up= (Average life expectancy- Median age at enrollment - Follow Up time) × OS gain as a fraction.
Average life expectancy = 75 years
Median age at enrolment = 50 years
Duration of follow-up = 10 years
(75 - 50 - 10 ) * 0.065 = 15 years * 0.065 = 0.975 years
Calculating Total life years gained
Life years gained during follow-up + Life years gained after follow-up
0.325 + 0.91 years = 1.3 years
Supplementary Table S1. List of references used for computation of cost-effectiveness of each treatment.

Supplementary Table 2. Conventional agents excluded from the analysis and cost per treatment course.
Supplementary Table S3. Potentially cost-effective treatments (Drug cost per life year gained between 3-4 times per capita GDP).
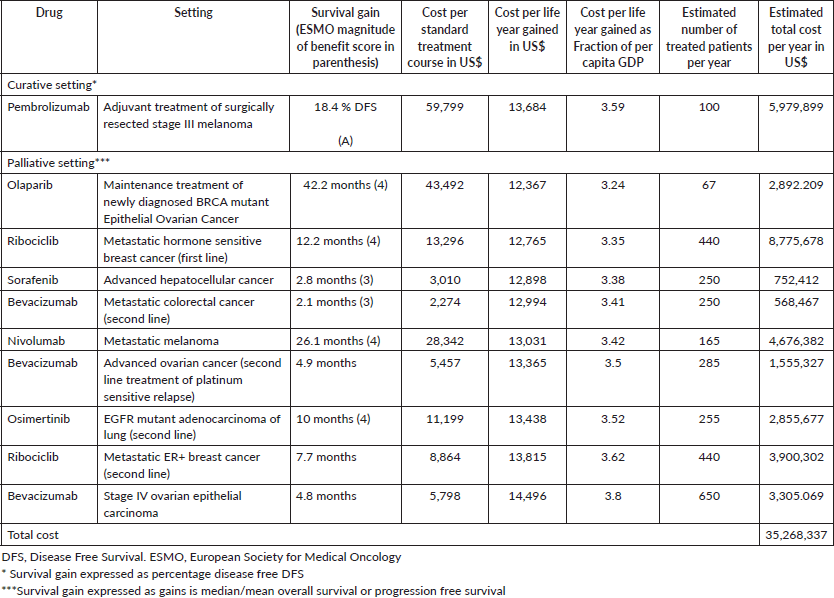
Supplementary Table S4. Treatments which are not cost-effective (Cost per life year gained more than 4 times per capita GDP).
